Applicants
How to Read the State of the Tech Workforce Report and Use It as Private Evidence
Private Evidence for High Salary Remuneration
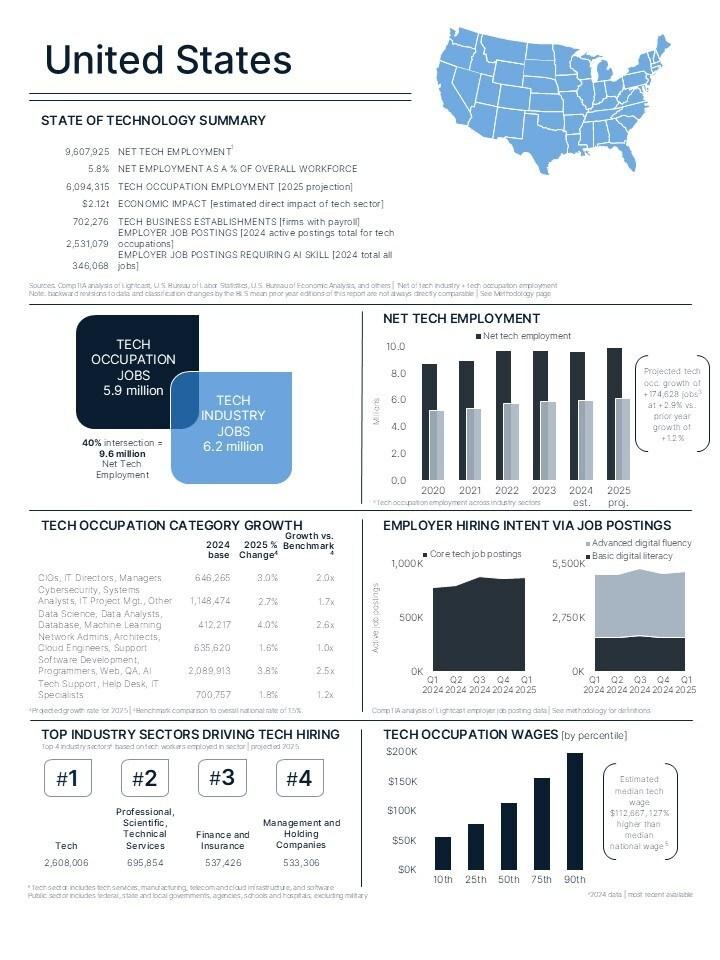
Every year, CompTIA publishes the State of the Tech Workforce report. On the surface, it looks like a labor market snapshot. In reality, it is a structured dataset that explains where technology work is concentrated, how it is valued, and how compensation differs across states and experience levels.
This article explains how to read the CompTIA State of the Tech Workforce report section by section, and how to responsibly use its national, state-level, and metro-level data to support high-salary and field-significance narratives without overstatement.
It walks through:
How national benchmarks establish field-wide compensation norms
How state-level data contextualizes salary relative to local labor markets
How metro-area insights explain competitive, high-density tech ecosystems
How to frame tech wage percentiles without over-claiming
How to align state-level and sector-level data with individual compensation
How to distinguish contextual labor market evidence from personal merit evidence
Paid users also receive direct access to the full CompTIA reports for independent review.
CompTIA State of the Tech Workforce 2024
CompTIA State of the Tech Workforce 2025
These reports serve as authoritative, third-party labor market references and are used strictly to establish objective field context, not as standalone proof of individual qualification .
1. Start With Net Tech Employment, Not Job Titles
One of the most misunderstood elements in the report is Net Tech Employment.
CompTIA defines net tech employment as a combination of:
Core tech occupations across all industries
Business and leadership roles inside tech companies
Full-time self-employed tech professionals
This matters because it shows that technology value is not limited to job titles or company names. Tech work permeates finance, healthcare, government, manufacturing, and professional services
When you reference this in private evidence:
You are establishing that your role exists inside a nationally recognized tech labor market
You are not relying on a narrow or self-defined classification
This is contextual grounding, not self-promotion.
2. Understand the Wage Percentiles Before Talking About Salary
The wage section is where most people make mistakes.
The report does not rely on averages. It relies on percentiles, which is exactly how serious labor analysis is done:
10th percentile reflects early-career or entry roles
25th percentile reflects developing professionals
50th percentile is the median
75th and 90th percentiles represent senior expertise and high-impact roles
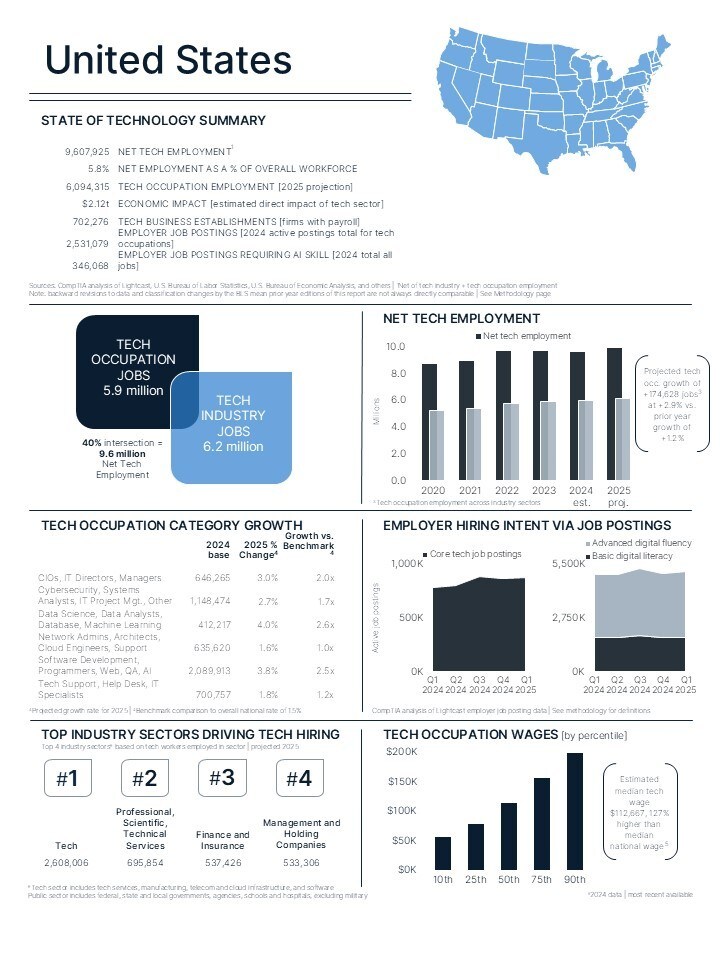
Nationally, the median tech wage exceeds $112,000, which is more than double the median wage across all U.S. occupations
This does not mean every tech worker earns that amount. It means the field itself commands premium compensation relative to the general labor market.
In private evidence, this supports one narrow claim only:
Compensation in this field is objectively high relative to the national workforce.
It does not yet say anything about you. That comes later.
3. Why State-Level Wage Data Matters More Than National Averages
High salary is never evaluated in a vacuum.
The same dollar amount has very different meaning in different states. The report explicitly cautions that cost of living and regional labor markets must be considered
This is why state-level wage percentiles are critical:
A $150,000 salary in Washington or California may align with the 75th percentile
The same salary in another state may sit at or above the 90th percentile
When you reference state data correctly, you are not arguing that your salary is high in abstract terms. You are showing that it is high relative to peers in the same labor market.
This is the only legitimate way to frame salary significance.
4. How to Use “Top States” Without Over-claiming
The report ranks states by:
Net tech employment size
Employment concentration
Projected growth
Economic impact
States like Washington, California, Virginia, Massachusetts, Texas, and New York consistently appear at the top across these dimensions.
Mentioning this does not mean:
You are more important because you live there
Everyone in these states is extraordinary
What it does mean is this:
These states represent highly competitive, mature, and compensation-dense tech labor markets.
If your compensation places you in the upper percentiles within one of these states, that strengthens the context of your salary evidence.
The report provides the field conditions. Your documents provide the individual facts.
5. Employer Hiring Intent Shows Market Demand, Not Individual Success
Another key section is employer job postings and hiring intent.
CompTIA shows millions of annual tech job postings, with significant demand for advanced digital fluency and AI-related skills .
This is useful only for one purpose:
- Demonstrating that the market actively competes for skilled professionals
It does not prove that you are exceptional. It explains why compensation escalates for experienced or specialized professionals.
Used correctly, this supports the logic of:
High compensation is a market response to scarcity and complexity, not an anomaly.
6. What This Report Can and Cannot Prove
This report can be used to show:
Tech is a nationally significant economic sector
Tech wages are materially higher than the general labor market
Certain states represent highly competitive compensation environments
Senior and specialized roles occupy upper wage percentiles
This report cannot be used to show:
That you personally are extraordinary
That salary alone proves merit
That everyone earning a high wage qualifies for special recognition
That distinction is critical.
The report is contextual evidence, not primary evidence.
7. How This Fits Into a Proper Private Evidence Strategy
In a well-structured private evidence set, this report typically appears:
As an appendix or background exhibit
Referenced by attorneys or evaluators
Used to anchor salary, role, or impact discussions in objective data
It should always be paired with:
Employer letters
Payroll records
Role descriptions
Comparative peer analysis
Evidence of responsibility, scope, or impact
When used this way, the report does exactly what it is meant to do:
It explains the field, not the person.
And that is precisely why it is credible.
Mid-Thoughts
High salary is never about the number alone. It is about where that number sits within a real labor market, under real competitive pressure, in a field that objectively commands value.
The State of the Tech Workforce report gives you the map.
Your own evidence shows where you stand on it.
Source: CompTIA State of the Tech Workforce 2025 and 2024 editions. Download two editions of private editions below.
8. Comparing Tech Talent by Industry Sector and Why It Matters
Another overlooked strength of the State of the Tech Workforce report is how it breaks down where tech professionals actually work, not just how many exist overall.
A common misconception is that tech professionals primarily work inside “technology companies.” The data shows this is only partially true.
According to CompTIA’s analysis:
Roughly 40% of tech professionals work directly in the tech sector
Approximately 60% work in non-tech sectors, embedded across the broader economy
This distinction is critical for private evidence because it reframes how impact and compensation are evaluated.
9. Top Industry Sectors Employing Tech Professionals
CompTIA consistently identifies the top industry sectors employing tech workers nationwide:
Technology sector
Software, IT services, cloud infrastructure, telecom, hardware
Professional, Scientific, and Technical Services
Consulting, engineering, analytics, cybersecurity services
Finance and Insurance
Banking platforms, payment systems, risk and fraud technology
Management and Holding Companies
Enterprise technology governance, shared services, global platforms
Together, these sectors account for the vast majority of tech employment in the United States .
What matters here is not the ranking itself, but what it implies:
Tech expertise is mission-critical far beyond software vendors
Organizations outside “pure tech” still compete aggressively for top talent
Compensation pressure exists across multiple industries, not just Silicon Valley startups
10. Why Sector Comparison Strengthens Salary Context
When salary is evaluated in isolation, it is easy to dismiss it as anecdotal.
When salary is evaluated within a sector-specific tech labor market, it gains structure.
For example:
A senior technologist in finance or professional services is not compared to the general workforce
They are compared to other tech professionals operating in high-revenue, high-risk, high-complexity environments
The report establishes that these sectors:
Employ hundreds of thousands to millions of tech workers
Generate substantial economic output
Sustain long-term demand for advanced technical and leadership skills
This allows a legitimate inference:
Compensation reflects sector-level competition for scarce expertise, not an inflated or artificial arrangement.
11. Sector Distribution Also Explains Role-Based Wage Differences
Another benefit of sector comparison is that it explains why wage ranges are wide even within the same job title.
A software engineer or architect may earn very different compensation depending on whether they operate in:
A small internal IT team
A regulated financial institution
A global professional services firm
A core technology product company
The report’s sector analysis helps evaluators understand that:
Higher compensation often correlates with risk, scale, and systemic responsibility
Senior roles embedded in critical sectors naturally cluster toward the 75th and 90th percentiles
This framing is consistent with how labor economists interpret wage dispersion, and it aligns with CompTIA’s methodology .
12. How to Use Sector Data as Private Evidence
Sector comparisons should be used carefully and narrowly.
Appropriate use:
Demonstrating that your role exists within a large, competitive tech labor segment
Showing that your employer operates in a sector known to command premium tech talent
Explaining why compensation norms differ from generic job-board averages
Inappropriate use:
Claiming sector importance alone proves individual merit
Suggesting that all sector participants are exceptional
Using sector size as a proxy for personal achievement
When used correctly, sector data provides contextual credibility, not self-assertion.
13. Putting It All Together
When combined, the report supports three layered conclusions:
Tech is a nationally significant and compensation-dense field
Multiple non-tech sectors employ massive numbers of tech professionals
High compensation often reflects sector-level competition and responsibility
Your individual evidence then answers a separate question:
Where do you fall within that landscape?
That separation between field context and personal proof is exactly what makes private evidence persuasive.
This article is general information, not legal advice. Meritocrat is a preparation tool, not a law firm, and does not replace qualified legal counsel.
Prepare your case in one connected workspace
Case Studio helps EB-1A, EB-2 NIW, and O-1 applicants organize evidence and review what supports each claim.